MaylandsWestern Australia · 4 km from the Perth CBD
What the public data says about Maylands: who lives here, what the offence rates are, and where the figures sit against the rest of the state.
Suburb summary
Maylands sits just 4.0 km from the Perth CBD, but what really sets it apart is the mix of housing. Separate houses make up 31.0% of dwellings, semi-detached homes and townhouses 33.2%, and flats or apartments 35.7%. That is about as close to an even three-way split as you will find in Perth, which gives buyers a much broader range of options than most suburbs.
The tenure split is just as balanced, with 48.7% owner occupied and 49.2% rented. Average household size is 1.9 people, pointing to a strong mix of couples and single-person households. Education levels stand out, with 40.5% holding a bachelor degree or higher compared with 23.9% across Western Australia. Full-time employment is 61.1% and median weekly family income is $2,386, against a middle WA suburb of 56.2% and $2,112.
Crime needs context. All six offence rates sit above the middle Western Australian suburb, and on its own that means very little, because half the state sits above the middle by definition. What matters is that none of them reaches Knome's concern threshold. Overall crime probability is 11.2 offences per 100 residents, against a middle suburb of 7.1 and a concern point of 12.71. Public housing is 4.4%, just below Knome's concern point of 4.6%.
Knome would approach Maylands by looking at the dwelling type first and the suburb second. With housing stock split so evenly, comparable sales only matter when you are comparing like with like. That holds whether you plan to live in it or let it, and with 49.2% of dwellings rented, both are common here. The pockets matter too. Maylands can change noticeably from one street to the next, so suburb-wide averages should be treated as a starting point rather than the answer.
Written by Knome, a licensed Perth buyers agency, RA87115. Published 2026.
Is Maylands safe?WA Police 2025
11.2 per 100 residents. Typical WA suburb 7.1. Above 12.71 it starts to become a concern.
1.5 per 100 residents. Typical WA suburb 1.14. Above 2.25 it starts to become a concern.
0.34 per 100 residents. Typical WA suburb 0.32. Above 0.66 it starts to become a concern.
0.20 per 100 residents. Typical WA suburb 0.12. Above 0.24 it starts to become a concern.
1.13 per 100 residents. Typical WA suburb 0.7. Above 1.36 it starts to become a concern.
1.69 per 100 residents. Typical WA suburb 1.28. Above 2.51 it starts to become a concern.
Rates are offences per 100 residents. The typical WA suburb is the middle suburb, so half sit above it. A rate in the highest quarter for the state is where it starts to become a concern. Lower is safer.
Offence counts WA Police 2025 · Populations ABS Census 2021 · Typical WA suburb calculated by Knome
Who lives in Maylands?ABS Census 2021
Middle WA suburb 56.2%. Below 53.5% it starts to become a concern.
Middle WA suburb 4.5%. Above 5.8% it starts to become a concern.
Middle WA suburb $2,112. Below $1,701 it starts to become a concern.
Middle WA suburb 1.5%. Above 4.6% it starts to become a concern.
Rated figures show where this suburb sits among Western Australian suburbs. Strong is the better half of the state and the far end is the outermost quarter, so the word means the same on every row. The scale always runs low to high, so green is on the right where more is better and on the left where less is.
ABS Census 2021 · Typical WA suburb calculated by Knome
Education
| Level | Maylands | WA |
|---|---|---|
| Bachelor degree and above | 40.5% | 23.9% |
| Advanced diploma and diploma | 10.5% | 9.3% |
| Certificate III and IV | 13.1% | 17.8% |
| Any post-school qualification | 64.1% | 51.1% |
ABS Census 2021 · Of people aged 15 and over
What are the homes like in Maylands?ABS Census 2021
Owned against rented
- Owned outright 18.2%
- With a mortgage 30.5%
- Rented 49.2%
- Other or not stated 2.1%
Of 6,351 dwellings
What the dwellings are
- Separate house 31%
- Semi-detached or townhouse 33.2%
- Flat or apartment 35.7%
- Other or not stated 0.1%
Of 6,351 dwellings
Against an address, not a suburb
Every figure above describes Maylands as a whole, not the property you are considering.
Four more checks only mean anything against a real address, because the answer changes between two streets and sometimes between two sides of one. They are what the free Red Flag Report runs, on screen, in seconds, without asking for anything.
Whether the property sits in a bushfire prone area on the state's mapping.
Whether the floodplain mapping reaches the block, which the suburb name never tells you.
Distance and exposure to the roads that carry the traffic, street by street.
Where the property sits under the Perth Airport flight paths and noise contours.
What we have bought in MaylandsEight properties
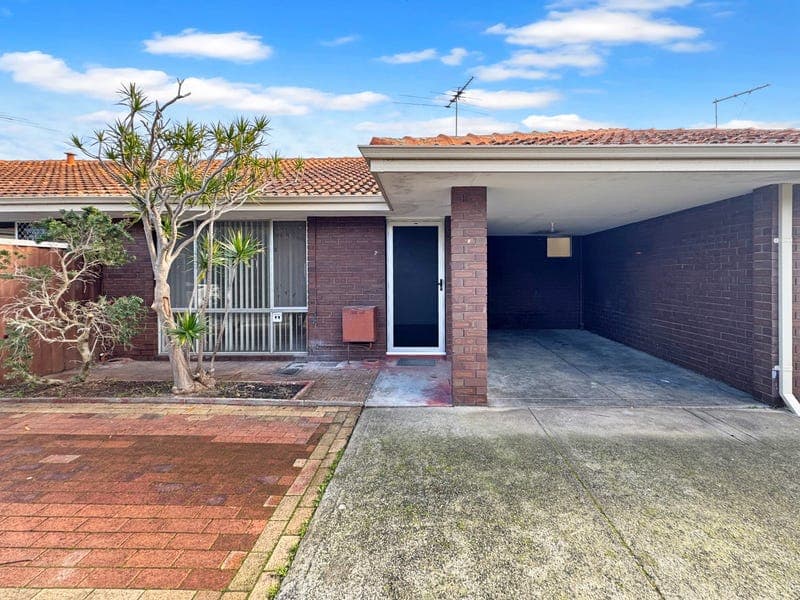
Also bought in Maylands
- 3/32 Peninsula Road, Maylands WA 6051
- 35/50 Kirkham Hill Terrace, Maylands WA 6051
- 6/27 Falkirk Avenue, Maylands WA 6051
- 3/7 Wall Street, Maylands WA 6051
- 7/15 Caledonian Avenue, Maylands WA 6051
- 2/30 Hubert Road, Maylands WA 6051
- 160/2 Wall Street, Maylands WA 6051
Addresses are a matter of public record, published by Landgate and the portals. Knome never names who bought a property.
Do you buy in Maylands?
Yes. Knome is a Perth buyers agency and Maylands, WA is inside the area we work. If you are looking here and want somebody on your side of the table, start a conversation on WhatsApp or Messenger.